Stand Sure is a firm specializing in Revenue Optimization™. It analyzes data and systems in the lead-to-close cycle.
As a company, you are asking: how do we increase revenue?
The traditional options are:
- Price - Have a sale - cut prices and hope demand increases
- Product - Develop new offerings
- Promotion - Increase advertising
- People - Hire new sales professionals
- Place - Open new offices
There’s a lot of risk and cost in the traditional options.
Our answers are:
- Do more with the leads you have;
- Do more with the web traffic you have; and then
- Consider the P’s
Stand Sure helps clients 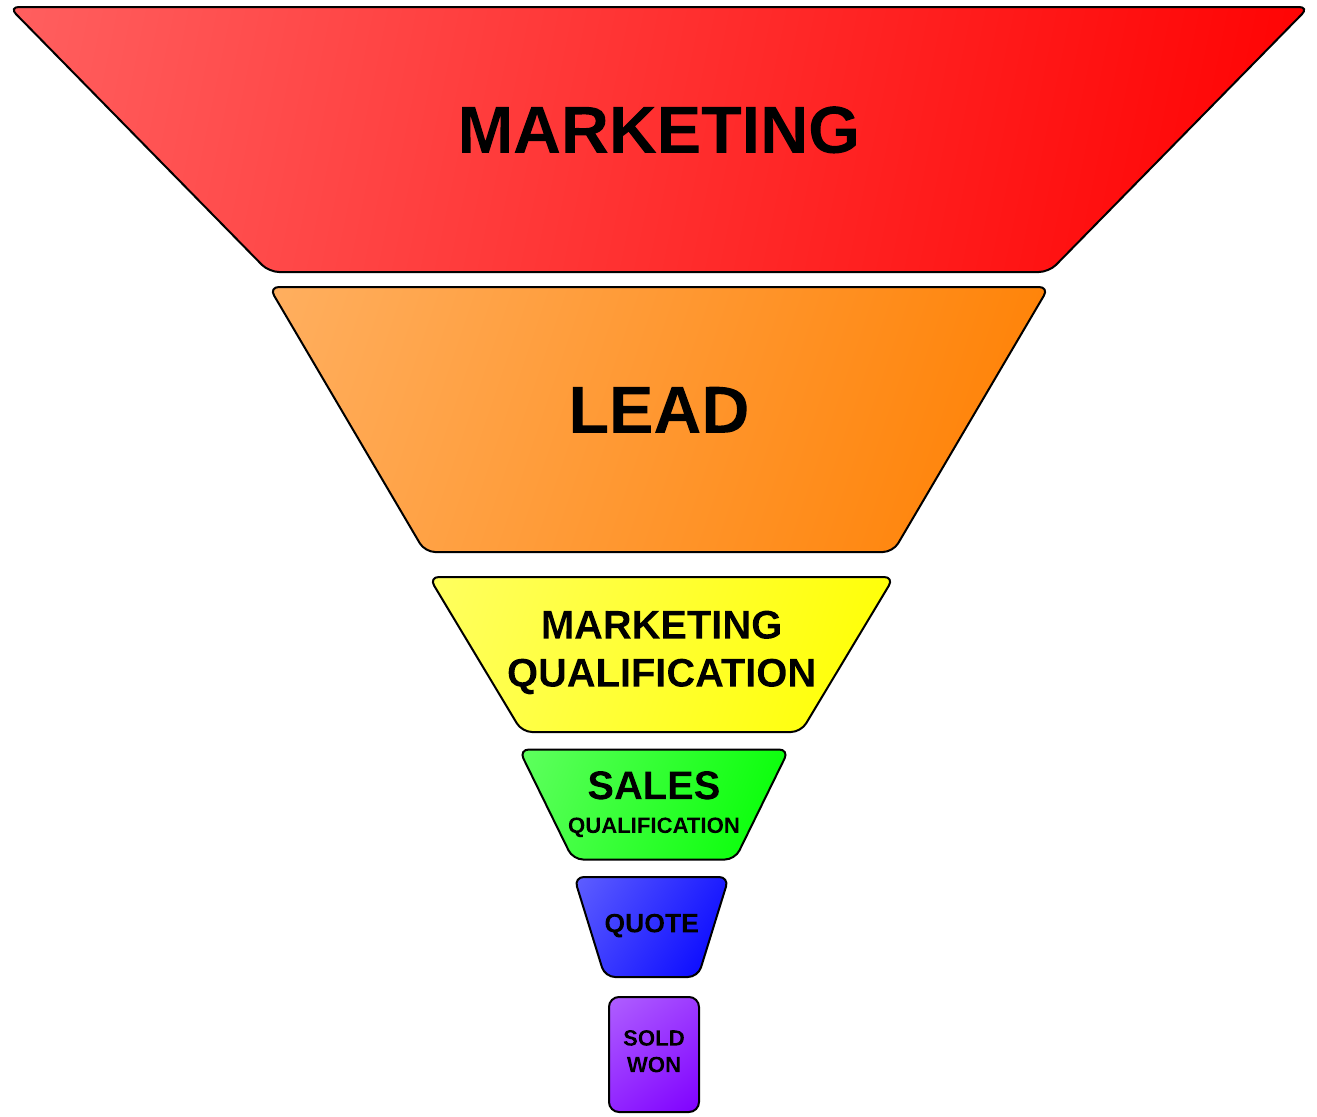
- widen the digital acquisition funnel without increasing marketing spend by suggesting
- information architecture improvements
- content updates and
- technical improvements
to better customer experience and sales
- improve the nurturing process of leads
to improve customer satisfaction and sales and
- improve sales efficiency by suggesting improvements in
- CRM
- marketing automation and
- lead scoring.
In the beginning…
Stand Sure spends a day with the major stakeholders from web, marketing, sales and technology to learn and understand your current process and goals.
This meeting starts at the high level with an “attach yourself to a sale” exercise (similar to the “Staple Yourself to an Order” idea in https://hbr.org/2004/07/staple-yourself-to-an-order) and then drills down into how the processes and systems interact.
We also perform a website health check (data flow to backend and analysis systems and also technical SEO).
Do more with the leads you have
|
Since dramatically increasing leads can overwhelm a sales team, we generally start by improving the performance in
- lead data quality
- lead to marketing qualified (MQ)
- MQ to sales qualified (SQ)
- SQ to quote
- Quote to sale
- Delivery to repeat sale and/or referral
How does Stand Sure help you sell more of the leads your marketing has already brought in?
We help you sell more by
- Improving your lead scoring
- Improving the ability of your marketing automation programs to qualify prospects
- Improving the ability of your sales professionals to prioritize prospects, work efficiently and collect useful predictive indicators
Lead Scoring
No “one size fits all” approach
We believe in distinct scores for each milestone in the lead-to-close process (i.e. separate scores for lead to marketing qualified, marketing qualified to sales qualified, etc.) -- a “one size fits all approach” does not work well for most companies.
Many of the lead scoring setups we see combine values based on explicit variables in a linear manner to come up with a lead score. Although it is easy to build this sort of model, the model is often driven by opinion and not fact. Even when data is used in the initial construction of the model, the assumption that all measurables matter the same in all scenarios is often wrong.
Our approach is to perform a data-driven recursive partitioning analysis. To illustrate this, we are going to use an example from publicly available lending data.
Suppose you want to only sell “good” loans and want to build a scoring model to predict good vs. bad.
An analysis of the “good”/“bad” rate as a function of the loan amount make look like the following:
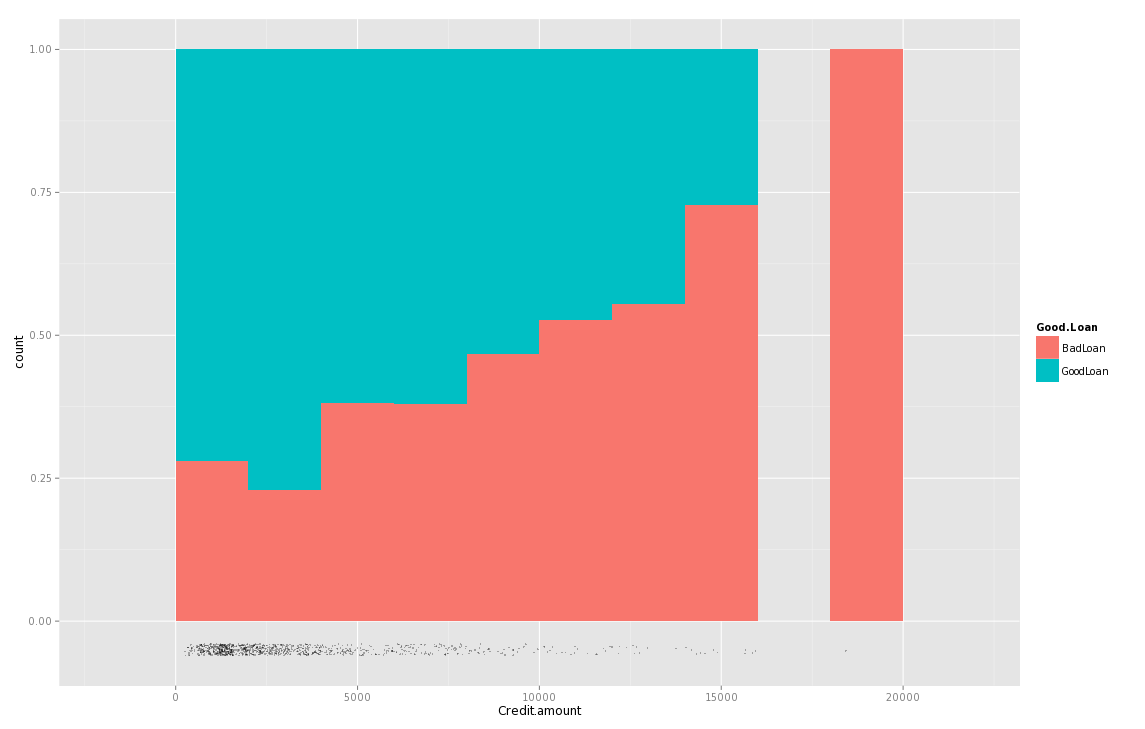
You also believe that the loan duration, percentage of disposable income taken up by payments and the amounts of other debts are factors.
The typical approach we see employed by most consultants is to assign scoring values to each of the credit amount “bins”, to assign scoring values to each of the other categories and to then combine the values to form a model.
A model like the following may result:
variable / rule
|
Estimate
|
(Intercept)
|
79.6643620
|
Duration.in.month
|
-0.6694831
|
Installment.rate.in.percentage.of.disposable.income
|
-2.5242434
|
Credit.amount.factor(2e+03,4e+03]
|
8.5780101
|
Credit.amount.factor(4e+03,6e+03]
|
-1.9165863
|
Credit.amount.factor(6e+03,8e+03]
|
1.2373990
|
Credit.amount.factor(8e+03,1e+04]
|
-7.0324245
|
Credit.amount.factor(1e+04,1.2e+04]
|
-8.1389012
|
Credit.amount.factor(1.2e+04,1.4e+04]
|
-12.4168327
|
Credit.amount.factor(1.4e+04,1.6e+04]
|
-28.3113127
|
Credit.amount.factor(1.8e+04,2e+04]
|
-45.0049284
|
Other.installment.plansnone
|
12.1190145
|
Other.installment.plansstores
|
2.7525413
|
The best linear model on this data set is 70% accurate. On a sample of 1000 values it misidentifies 271 bad loans as good and 28 good loans as bad.
Our approach is to use the data to use data-driven recursive partitioning, which produces a model like the following:
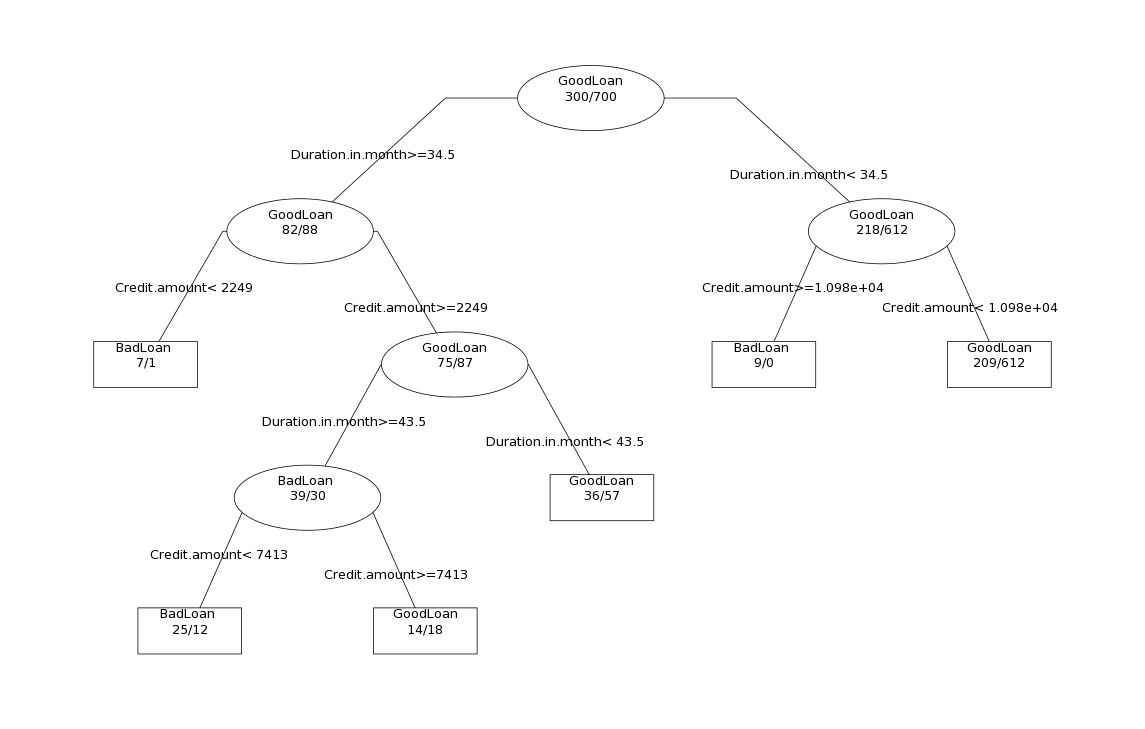
This model is 75% accurate and is easy to use and program into your marketing automation system (or CRM system).
On the same 1000 samples as used above, this model lowers the false good count by 14% and the lowers the false bad rate by 18%. These are meaningful improvements.
Additional Explicit Factors
Most analysts will do in-depth interviews (IDIs) with sales to identify explicit measurable, capturable factors that seem to matter in the sales process [we do this too]. Most analysts stop there [we do not].
Other factors that we have found that can matter in scoring are
- lead acquisition source/medium
- user intent when signing up on your website
- search terms
- sign-up page
- user session count
- users who come to your site only once and sign up may be different than users who come to the site many times before providing information
- user page views during the sign-up web session
- similarly, a user that comes to the site and immediately signs up may be different than one who pokes around a bit before converting to a lead
- website clickstream behavior (pre sign-up)
- users who behave like other users on the web often behave like them with respect to purchasing
We combine these explicit factors into the lead scoring model.
If your business has repeat sales, we also attempt to use RFM (recency, frequency, monetary value) data in the scoring model.
Implicit Factors
A prospect that does well on explicit criteria but suddenly stops interacting with your brand (visiting your website, opening emails, etc.) is less likely to convert than a prospect with the same explicit score that is still interacting with your brand and is often less likely to convert than an engaged prospect with a weaker explicit factor score.
If your marketing automation system supports it, we’ll help you build an implicit model that uses brand engagement.
If your system does not, in some cases, we can build a custom solution to feed this data into your system [NB the caution relates to the amount of lifting required by your teams to add a unique pixel to an email and to automatically import data into your system].
Marketing Automation to Improve Qualification Rates
We work with your internal teams to use what we can infer about the prospects in your database from other similar prospects to suggest email messages that can be sent to encourage them to “put their hand up” and self-qualify.
If the prospect opens the qualification email and then clicks on the CTA or forwards the email to another, that is a strong signal that the prospect has the trait that the qualification email was trying to identify. This signal is then used to adjust the lead score and the data is fed into your CRM system to help your sales professionals. This is called “progressive profiling”.
Unqualified and/or inactive leads are handled by automation to drip nurture and hopefully reactivate them.
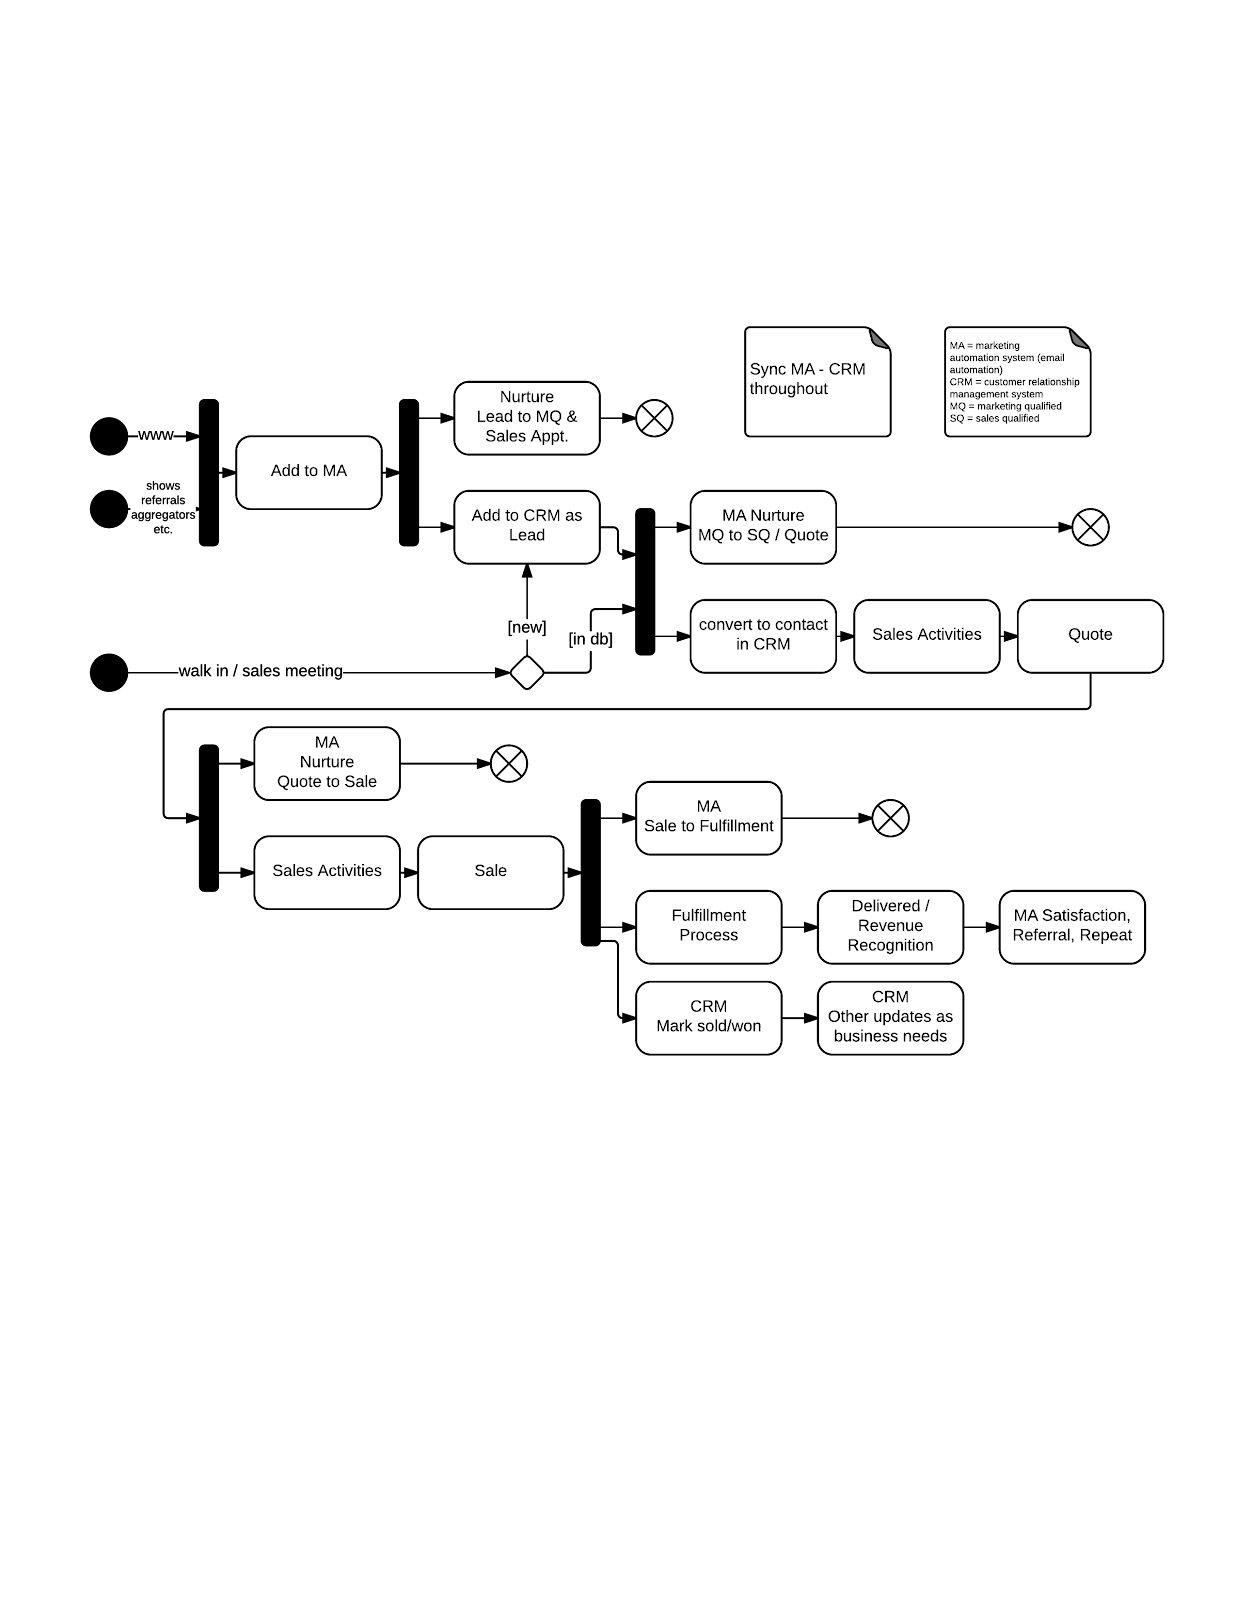
In the chart below, a best practice customer handling flow is shown. Missing from this diagram are activities to recover dead prospects in each stage.
Help sales prioritize prospects, work efficiently and collect useful predictive indicators
A large number of CRM implementations are set up in ways that make their usage feel like a burden to many users.
Stand Sure will help you build useful reports and dashboards for your sales teams.
We will also work with you to figure out how to
- promote and increase the collection of useful predictive data by sales and
- more and better data = better lead scoring = more sales
- streamline the systems process
- sales time should be spent on selling and not jumping through system hoops
Do more with the web traffic you have
|
Most websites have
- poor visit-to-lead conversion funnels,
- dead end paths,
- navigation flows that do not match user intent and
- lead forms that do not capture user intent.
Once your backend systems are doing a better job prioritizing and filtering prospects, we work with you and your web developers (or one of our partners if you do not have web dev resources) to increase the lead volume by improving your site.
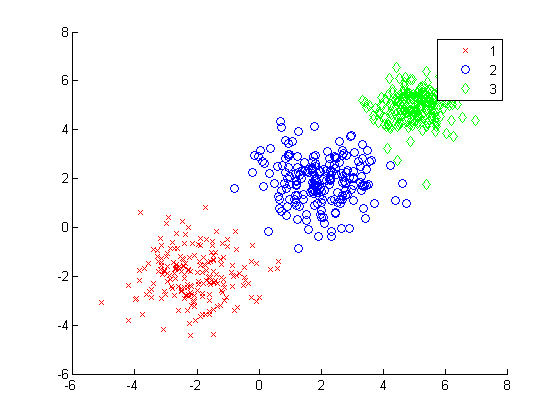
Some of the techniques we may employ to figure out what improvements to make to the site are:
- clickstream cluster analysis,
- lead sign-up funnel optimization (and the creation of new pathways to lead based on what we see users doing on your site),
- A/B testing and
- heatmaps (eye tracking, click tracking and scroll tracking)

At a previous company, our founder, Chris Anderson, increased leads by ~375% over four years without increasing the marketing budget. Part of this gain came from getting smarter with how search engine marketing was executed.
Stand Sure will help you measure, manage and coach the performance of your digital marketing partners -- we call this “success management™”. These subject-matter experts tend to be very good at what they do, but also tend to be myopic, looking only at their small piece of the puzzle and not how it impacts your revenues -- we help you change that.
To this end, we create daily-updating analytics tools to combine Google Analytics, AdWords and other data. These tools allow your internal teams that are responsible for sales and marketing results to be smarter about the decisions they make.
If the lead-to-close time is short enough, Stand Sure can provide actionable closed-loop and return on ad spend (ROAS) visualizations and reports. If the time is not short enough, we can often create actionable charts based on an earlier customer milestone that is within the digital marketing measure window.
If your digital media landscape combines SEM with other channels that are capable of indicating source/medium in the landing page URL (e.g. display), Stand Sure is able to build data-driven attribution models to help your marketing teams figure out what the contribution of non-last-click interactions is in aggregate.
Some (scrubbed) examples of the output from the daily tools follow:
Lead Mix (last-click) over time

Paid Search mix and costs over time

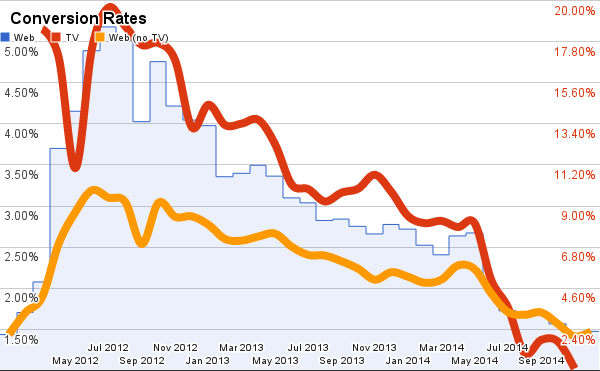
Website conversion rates over time
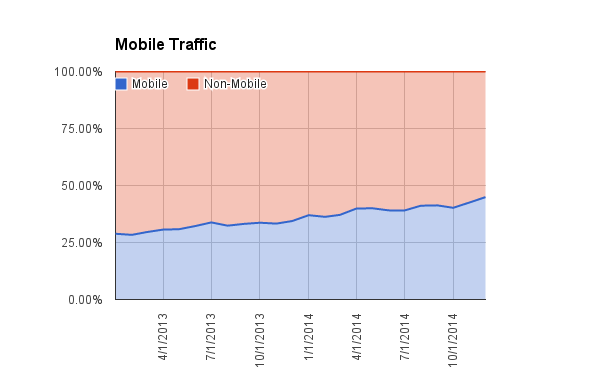
Mobile share over time
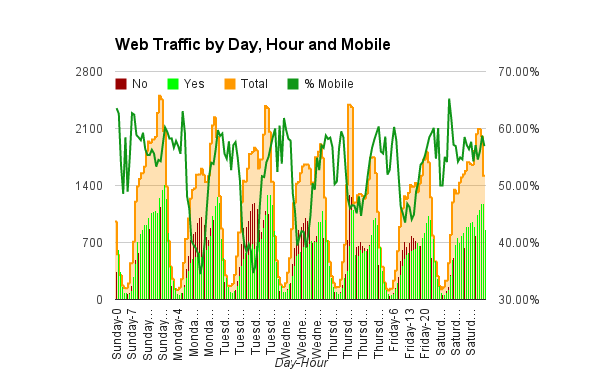
Traffic by day, hour and device profile
No comments:
Post a Comment