A free sales forecasting tool from Stand Sure
'Tis the season for many things -- including sales forecasts.
There are three universal truths about sales forecasts:- They are always wrong.
- No one will admit that they are.
- Someone will hold you to the forecast.
We've created a free tool that you can use to help figure this out. It's a Google spreadsheet that you can open and copy. It's at Google Sheet: Smoothing Event Times
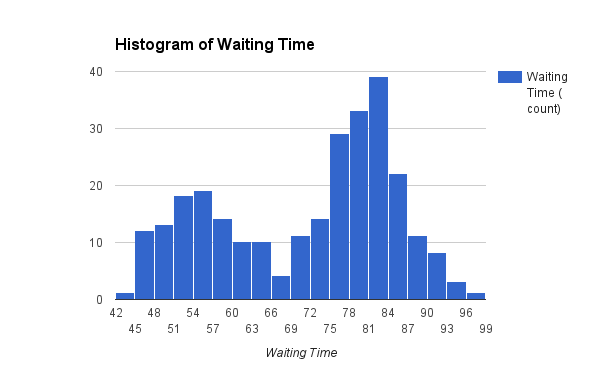
The problem most face is that the time to win/sell varies widely and has multiple peaks, viz.

The most common approach (and one that screws people up) is to take a straight average -- the cyan line in the graph below. In most cases, using this as the estimate, causes the forecast to predict sales too early.

What you really want is to come up with the red line and to figure out what percentage of your prospects are at each peak.
Our free tool helps you do this. It's designed for a two peak scenario.
Here's how to use the tool:
- Open the link.
- Copy the spreadsheet (you'll need to sign into your Google account in order for the Copy option in the File menu to become available).
- On the input tab, paste the number of days from start to sold/won for each sale in the period you're using to make the estimate. [We've shaded the paste area orange]
- OPTIONAL: Adjust the smoothing value [Colored magenta]
- Go to the Group Counts tab and read off the values.
- The Group is the number of days at the peak in the curve.
- The Count is how many of the sales in the data were closest to the peak.
- The Proportion is the fraction of the prospects that should be assigned this time to sell/win in your forecast.
If you have any questions about using the tool, we're happy to help.
If you need a more rigorous analysis done, please let us know. A simple forecast analysis takes us about 3 hours (2 calls, analysis & written report).
Happy holidays & happy selling!
Chris Anderson
CEO
www.standsure.io


No comments:
Post a Comment